Conversion Optimization Best Practices That Turn More Visits Into Customers
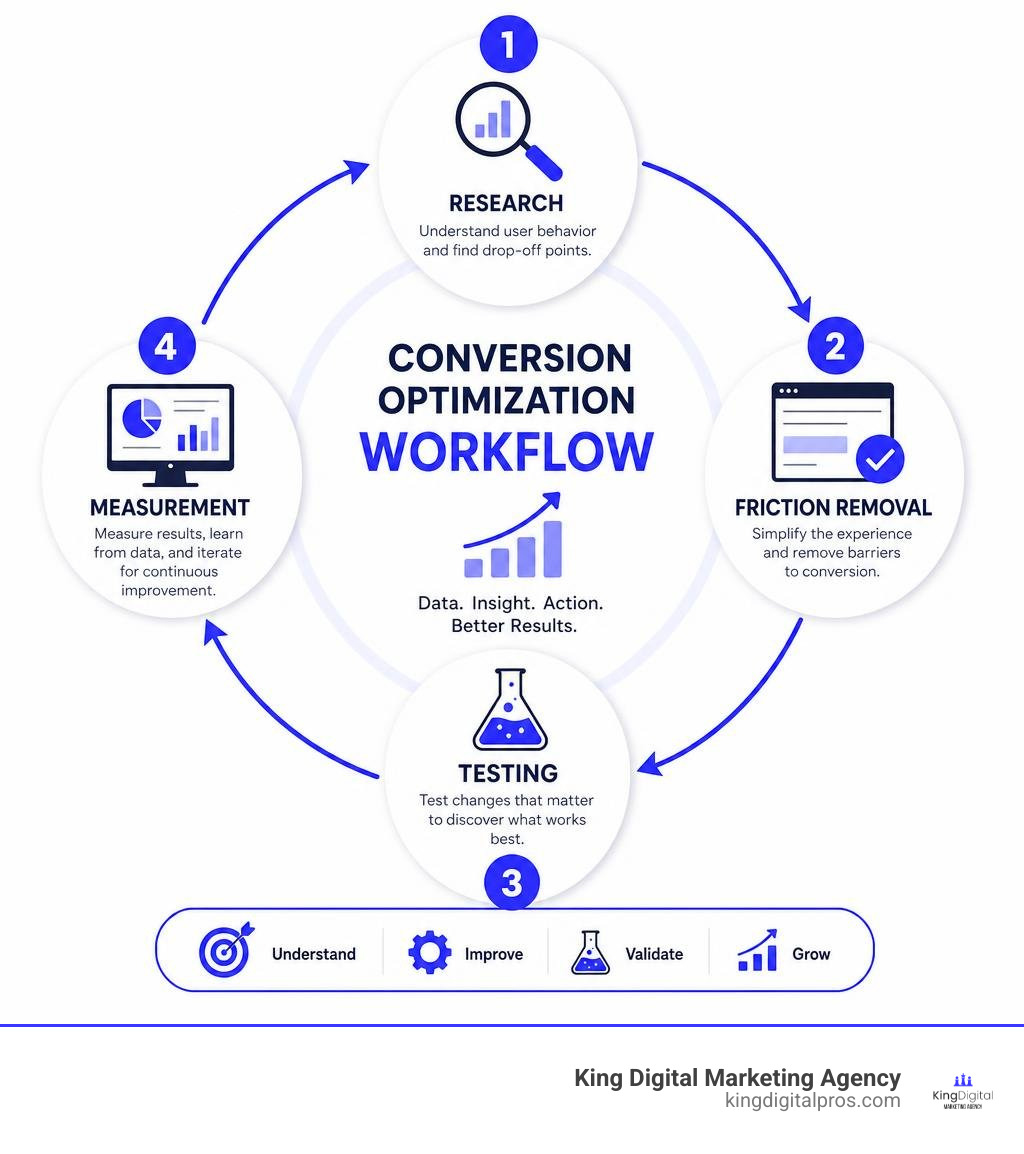
Conversion optimization best practices help you turn more of your existing website visitors into calls, bookings, leads, and sales without simply spending more on ads.
The quick answer: focus on the places where customers get stuck, make the next step clear, and use real data to verify what works.
- Find drop-off points with analytics, heatmaps, session recordings, and customer feedback.
- Remove friction from key pages, especially mobile pages, forms, and checkout.
- Match page headlines and offers to what visitors searched for or clicked.
- Make calls to action clear, specific, and easy to tap.
- Build trust with reviews, policies, pricing clarity, and security signals.
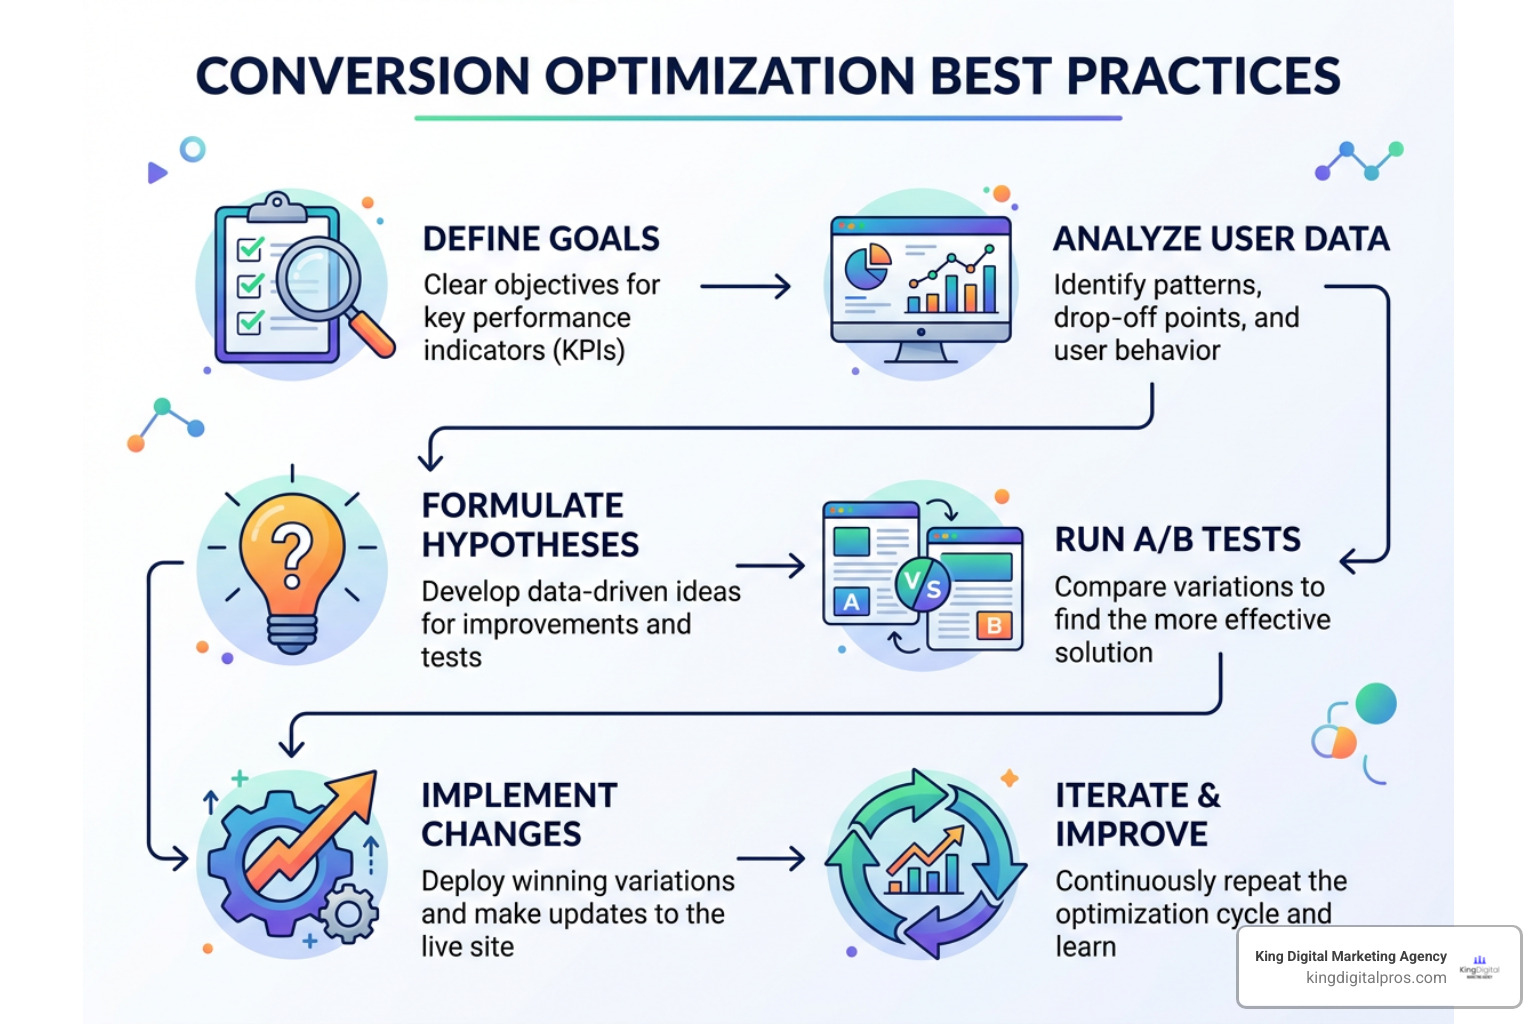
- Test meaningful changes, measure results correctly, and keep a record of what you learn.
This matters more in 2026 because customer acquisition costs have risen sharply over the past decade. Privacy changes also make your website and its first-party customer data more valuable. Instead of paying for more traffic that may not convert, a structured CRO program helps your business get more value from the people already finding you.
For local businesses, conversion optimization is not only about online carts. A conversion may be a phone call, quote request, appointment booking, direction request, or form submission. Small points of friction, such as a slow mobile page, confusing service information, or a hard-to-find contact option, can send a ready-to-buy customer to a competitor.
I am Bernadette King, founder of King Digital Marketing Agency. My background in persuasive copywriting, SEO, paid advertising, and growth strategy shapes a practical approach to conversion optimization best practices that helps small businesses turn online visibility into measurable growth.
Why Conversion Rate Optimization is Vital in 2026
Relying exclusively on paid ad channels to drive revenue has become increasingly expensive. Over the past decade, customer acquisition costs (CAC) jumped by 222%. Skyrocketing ad rates, privacy-driven attribution gaps, and intense digital competition mean buying traffic alone no longer guarantees profitability. If your digital bucket is leaking, pouring more expensive traffic into it only drains your budget faster.
Understanding what is Conversion Optimization and how it drives more sales shifts your focus toward maximizing the value of visitors you already attract. When you improve your site’s conversion performance, your cost per acquisition drops naturally, giving your business a compounding advantage over competitors who rely solely on ad spend.
Privacy shifts and the deprecation of third-party cookies have fundamentally altered digital tracking. Your owned digital properties – your main website, landing pages, and local search assets – are now your primary engine for collecting compliant, first-party behavioral data.
At the same time, AI search experiences and direct-answer platforms compress top-of-funnel browsing. Visitors who click through to your site today arrive with clearer intent and higher expectations. AI-referred traffic has shown significant growth, surging 55% year-over-year to reach a 1.3% conversion benchmark. Following proven Conversion Rate Optimization Best Practices ensures these high-intent visitors immediately find clear value, responsive design, and intuitive pathways to connect with your business.
Building a Structured CRO Process: Research, Hypotheses, and Prioritization
Many businesses approach conversion rate optimization like an ad-hoc chore: they change a button color, tweak a headline based on internal opinions, or launch a single A/B test without tracking learnings. When the test fails or proves inconclusive, they abandon optimization altogether.
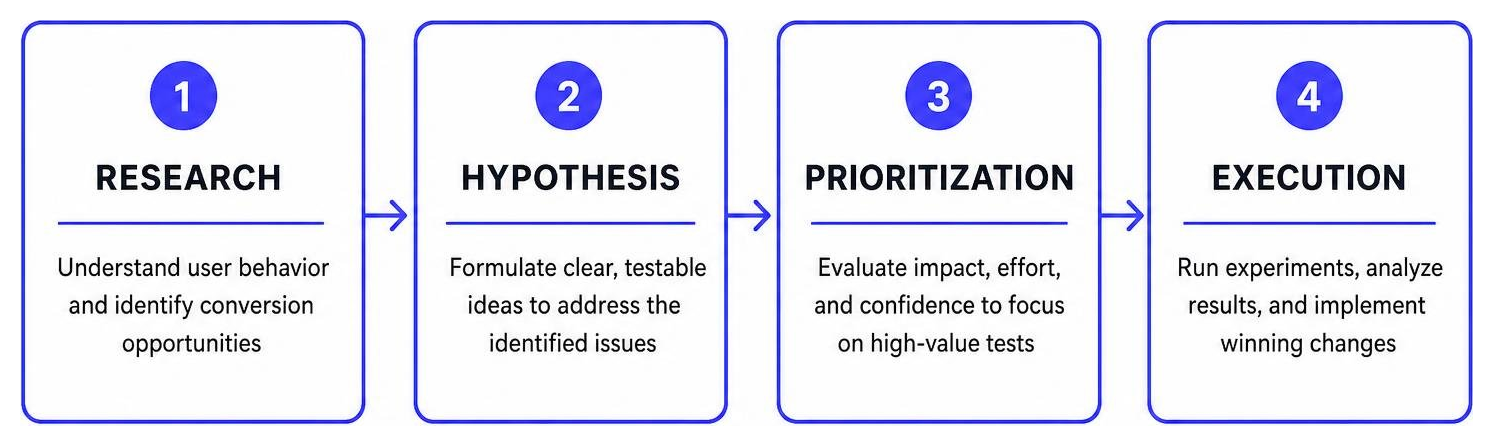
A successful conversion program moves beyond guesswork. We establish a continuous experimentation loop grounded in systematic research, structured hypothesis creation, and rigorous prioritization.
Research Methods for Uncovering Conversion Blockers
Before attempting to fix a low-converting page, you must diagnose where and why visitors drop off. We divide conversion research into quantitative data (showing where friction occurs) and qualitative insights (revealing why users experience frustration).
Quantitative data points pinpoint key drop-off zones across your site funnel:
- Bounce Rate by Traffic Channel: Pinpoints traffic sources that fail to match your landing page messaging.
- Form Field Drop-off Rates: Identifies specific form inputs causing user hesitation or abandonment.
- Exit Rate on High-Intent Pages: Highlights pages where interested buyers leave before taking action.
- Device-Specific Conversion Rates: Exposes hidden technical or user experience barriers on mobile devices.
Complement quantitative metrics with qualitative research to understand user sentiment. Heatmaps reveal scroll depth and identify click patterns, showing whether visitors tap on non-clickable elements. Session recordings allow us to observe real visitors navigating your pages, uncovering hidden usability glitches. Exit surveys and post-purchase questionnaires provide direct feedback about customer hesitations.
Conducting a thorough Conversion Funnel Analysis ensures you evaluate every step of the buyer journey, replacing assumptions with concrete behavioral evidence.
Formulating Evidence-Based Hypotheses and Prioritization Frameworks
Once your research reveals user friction points, transform those findings into actionable problem statements and structured hypotheses. A strong CRO hypothesis follows a clear structure:
“If we [implement specific change], then [expected metric improvement] will occur, because [qualitative/quantitative data insight].”
For instance, rather than testing a random button color, structure your hypothesis around user intent: “If we replace our generic ‘Submit’ button with a benefit-driven call-to-action reading ‘Get My Free Service Estimate,’ then lead conversion rates will rise, because session recordings show users hesitate when value isn’t reinforced at the click point.”
Research shows that teams using data to inform their hypotheses achieve win rates between 20% and 30%, compared to just 10% for teams experimenting with uninformed ideas.
Because you will often generate more ideas than available testing bandwidth allows, evaluate your test backlog using established prioritization frameworks:
- The ICE Framework: Evaluates ideas based on Impact (how much lift will this produce?), Confidence (how strongly does data support this hypothesis?), and Ease (how simple is technical implementation?).
- The PIE Framework: Ranks opportunities by Potential (how much room for improvement exists on this page?), Importance (how valuable is this page traffic?), and Ease (how much effort is required?).
Implementing structured frameworks like those detailed in CRO Best Practices: 16 Techniques That Convert (2026) ensures your team spends time testing ideas with the highest potential revenue impact.
Mastering A/B Testing Best Practices and Statistical Validity
A/B testing serves as the backbone of evidence-based optimization. However, running flawed tests leads to false positives, misallocated budgets, and misleading conclusions.

To maintain testing integrity, follow these core statistical rules:
- Pre-Calculate Sample Size: Determine required sample sizes upfront using your baseline conversion rate and minimum detectable effect. Ending a test early because a variant appears to be winning introduces false-positive rates that can exceed 30%.
- Run Complete Weekly Cycles: Always run experiments for a minimum of 1 to 2 full business weeks (typically 14 full days). This accounts for day-of-week behavioral fluctuations, such as weekend versus weekday visitor intent.
- Maintain a 95% Statistical Confidence Threshold: Do not declare a winning variation until your testing engine reaches at least 95% statistical significance, confirming that observed lifts stem from your changes rather than random variation.
- Avoid Test Peeking: Calling a test early when numbers look favorable corrupts data validity. Commit to the full test duration calculated during planning.
- Segment Test Results: Examine experiment performance across key segments, such as mobile versus desktop, or new visitors versus returning visitors. Aggregate flat results often mask massive mobile wins or device-specific regressions.
Following verified Conversion rate optimization best practices guarantees your experimentation program delivers reliable business insights.
Core Conversion Optimization Best Practices for High-Impact Page Elements
While every site requires custom research, high-performing websites consistently optimize three critical areas: mobile user experience, form design, and dynamic personalization.
Mobile Conversion Optimization Best Practices
Mobile commerce accounts for more than 60% of total web traffic, yet desktop traffic still converts at a rate 74% higher than mobile. This gap stems primarily from mobile usability friction rather than lower visitor intent.
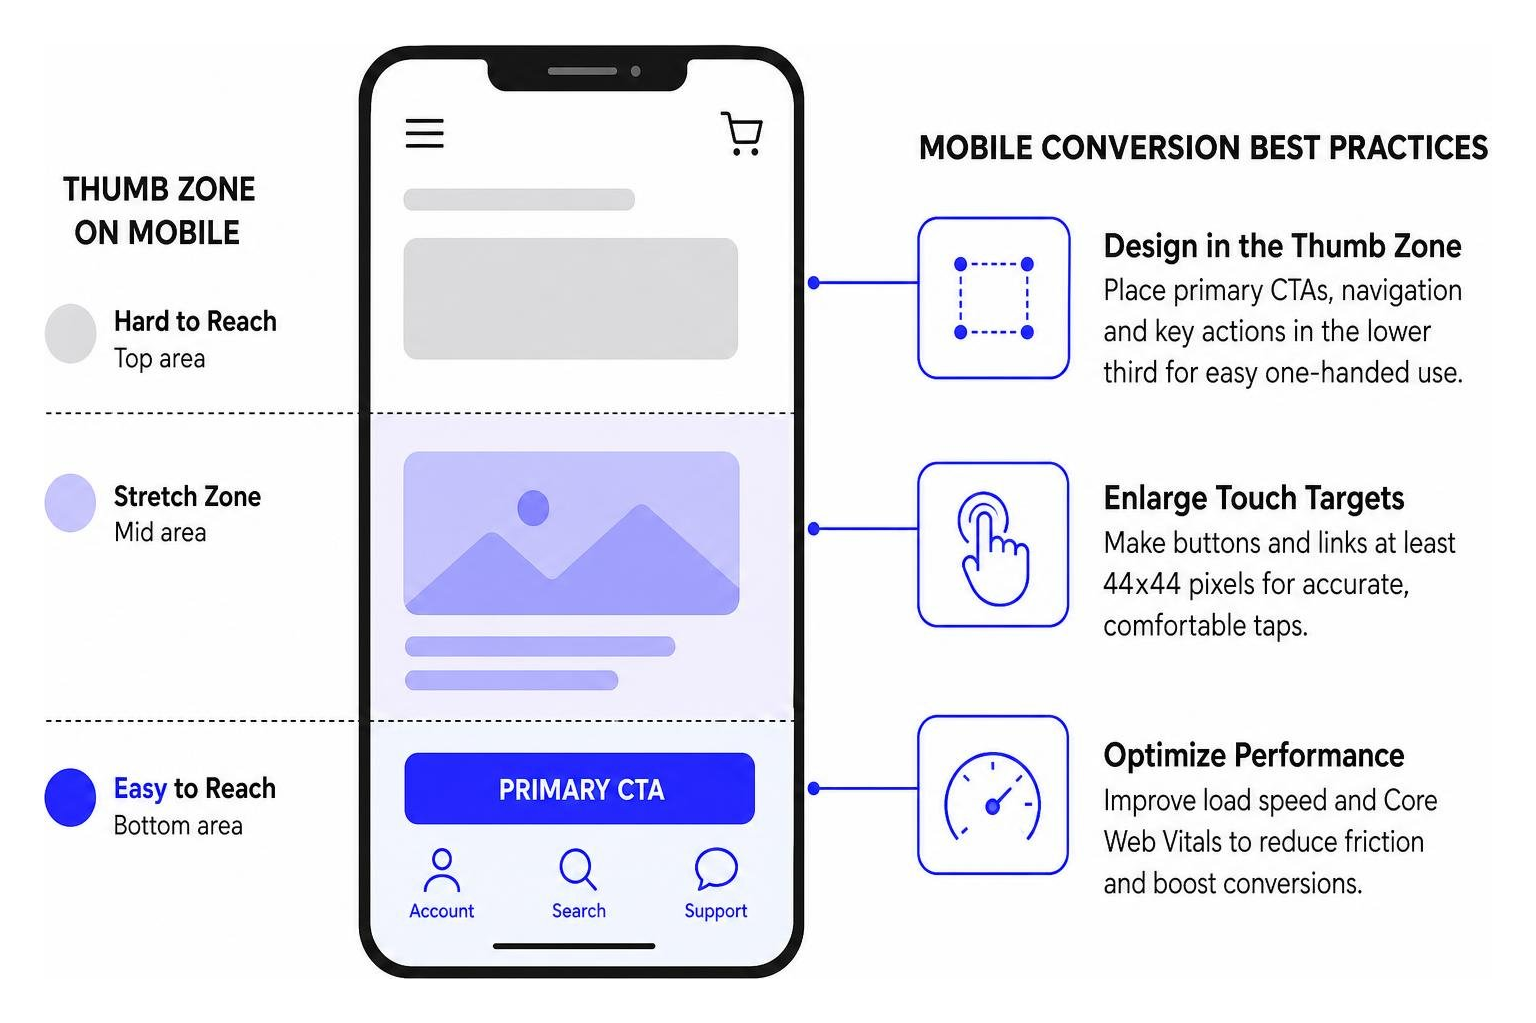
Closing the mobile conversion gap requires addressing key technical and design elements:
- Design for the “Thumb Zone”: Position primary calls-to-action, navigation buttons, and form submission fields within the lower third of the mobile screen for effortless one-handed tapping.
- Enlarge Touch Targets: Ensure buttons and interactive links measure at least 44×44 pixels, preventing accidental taps and user frustration.
- Eliminate Core Web Vitals Bottlenecks: Google’s Largest Contentful Paint (LCP) threshold is failed by nearly 40% of websites. A 0.1-second improvement in mobile load speed generates an 8.4% conversion lift for retail and over 10% for service industries.
- Optimize Input Keyboards: Trigger numeric keypads automatically when users focus on phone number, zip code, or credit card fields.
Reviewing The Complete Guide to Landing Page Conversion Rate Optimization provides actionable steps for building responsive landing pages that turn mobile clicks into paying customers.
Form and Checkout Conversion Optimization Best Practices
Forms and checkouts represent the final hurdle in your conversion funnel. Usability studies show that 18% of online shoppers abandon purchases due to long or complex checkout flows.
The average desktop checkout presents over 23 form elements by default, whereas high-converting checkouts complete transactions using just 12 to 14 elements. Every unnecessary field added to a form decreases overall submission rates by 7% to 11%.
| Optimization Factor | Low-Converting Checkout Flow | High-Converting Checkout Flow |
|---|---|---|
| Account Creation | Mandatory account registration before starting purchase (drives 19% abandonment) | Guest checkout default with optional post-purchase account creation |
| Field Labels | Unclear inline inputs; optional fields left unlabelled | Clear labels distinguishing required vs optional inputs; auto-fill enabled |
| Pricing & Fees | Hidden shipping fees or service charges revealed at final payment step | Transparent total cost calculation displayed early in funnel |
| Form Inputs | Long single-page form collecting non-essential demographic details | Streamlined 8 to 12 essential fields or multi-step progressive forms |
| Trust Signals | Generic payment buttons without security badges or policy links | Visual security encapsulation, SSL badges, and prominent return guarantee links |
Implementing documented checkout improvements lifts conversions by an average of 35.26%, unlocking significant recoverable revenue.
Ensuring key Components of High Converting Websites are integrated across your checkout flow eliminates drop-offs at critical decision points.
Leveraging Personalization and First-Party Data
Delivering a generic web experience to every visitor lowers campaign effectiveness. Personalization programs that utilize real-time behavioral data can reduce customer acquisition costs by up to 50% while lifting overall revenues by 5% to 15%.
Personalized experiments deliver 41% more impact than static web variations. Effective personalization strategies leverage key behavioral signals:
- Traffic Source Alignment: Match landing page headlines, hero graphics, and offers directly to the ad copy or search intent that brought the visitor to your page.
- Visitor History Customization: Returning visitors convert at 2.9% compared to 1.7% for first-time visitors. Tailor returning visitor experiences by highlighting previously viewed service pages or simplifying repeat bookings.
- Geographic Relevance: Display localized contact numbers, local service area badges, and community-specific testimonials to visitors based on location data.
Adopting frameworks outlined in The Complete Conversion Rate Optimization Guide 2026 helps you build personalized customer journeys while maintaining complete privacy compliance.
Measuring and Communicating CRO ROI to Stakeholders
To secure ongoing support for conversion optimization, present your results using business metrics that resonate with leadership and business owners.
Optimizing purely for conversion rate can occasionally obscure business performance. For example, offering extreme discounts might raise overall conversion rates while lowering total profit margins.
Focus tracking on Revenue Per Visitor (RPV), which multiplies conversion rate by Average Order Value (AOV). This ensures experiments generate meaningful revenue growth rather than inflated click counts.
Communicate program value through clear financial metrics:
- CAC Efficiency Gains: Demonstrate how lifting site conversion rates reduces effective cost-per-lead across paid channels.
- Compounding Revenue Impact: Highlight how a 5% monthly conversion improvement yields significant year-over-year revenue expansion without increasing ad spend.
- Risk Mitigation Value: Document how inconclusive and losing tests protect your business from deploying unproven redesigns that would have degraded site performance.
Refining your Call to Action Strategies for Conversions builds executive confidence by linking strategic UX changes directly to bottom-line results.
Frequently Asked Questions about Conversion Rate Optimization
What is a good conversion rate in 2026?
Across global website benchmarks, average conversion rates range between 2% and 5%. However, performance varies significantly by industry vertical, device type, and traffic source:
- E-commerce Stores: Typically average 1.8% to 3.0% overall conversion rates.
- Local Service Businesses: Dedicated landing pages often hit 6% to 12% lead conversion rates for phone calls and form requests.
- Top Quartile Performers: Top 10% of optimized websites convert at rates exceeding 11%.
Focus primary optimization goals on outperforming your historical baseline rather than chasing generic industry averages.
How long should an A/B test run to get valid results?
An A/B test should run for a minimum of 2 full weekly cycles (14 days) and continue until your pre-calculated sample size achieves 95% statistical significance. Running tests across two complete weekly cycles accounts for day-to-day behavioral variances between weekdays and weekends.
For lower-traffic websites, standard A/B tests can take 4 to 8 weeks to reach valid sample sizes. In these scenarios, use qualitative research methods, such as heatmaps, session recordings, and usability testing, to validate design improvements before running live experiments.
What is the difference between Conversion Rate and Revenue Per Visitor?
Conversion Rate measures the percentage of site visitors who complete a target action (such as placing an order or filling out a form).
Revenue Per Visitor (RPV) measures total revenue generated divided by total unique site visitors over a specific time frame.
RPV serves as a broader financial metric because it combines conversion rate and average transaction value into a single metric. This prevents misinterpreting “winning” variations that raise transaction counts while reducing total revenue through discounting.
Conclusion
Building an effective conversion program is a continuous business discipline rather than a one-time project. By combining rigorous behavioral research, evidence-based hypotheses, statistical testing discipline, and mobile-first design, you transform your website into a reliable engine for business growth.
As customer acquisition costs rise, businesses that master conversion optimization gain a permanent competitive advantage. Focusing on friction removal, clear messaging, and user trust turns more of your current site traffic into measurable revenue.
Partnering with King Digital Marketing Agency gives your business access to strategic growth frameworks tailored to your local market. Whether serving clients in Albuquerque, Santa Fe, Rio Rancho, Corrales, or surrounding New Mexico communities, we help local service providers turn online search visibility into consistent calls, leads, and customer bookings.
Ready to unlock hidden revenue from your existing website traffic? Explore our specialized Digital Marketing Services for Conversion Optimization today and discover how our data-driven frameworks build lasting growth for your business.
